Oct 2026 to Nov 2026
Chemical Inventory Reconciliation
A data analysis project built end to end on synthetic data modeled on a university Environmental Health & Safety (EH&S) chemical inventory. A messy system export is cleaned in SQLite, reconciled container by container against field checks of 14 labs in Power Query, and followed up with VBA-generated lab reports and reminder email drafts and a Power BI dashboard.
17.1% of containers checked had a discrepancy (77 of 450). Two of the 14 visited labs, L04 and L11, held 19% of the containers but 38% of all discrepancies, and accounted for every out-of-date contact record.
Platform
The problem
Chemical inventory records drift from what is actually on the shelves, especially when lab members turn over. This project asks where the records have drifted, by how much, and what to do about it. The scenario is an EH&S analyst for four buildings and 20 research labs whose inventory system has not been checked in a year, right after visiting 14 of the labs.
All of the data is synthetic. A Python script generates it with a deliberately seeded pattern (high turnover in labs L04 and L11), so the analysis can be checked against a known answer.
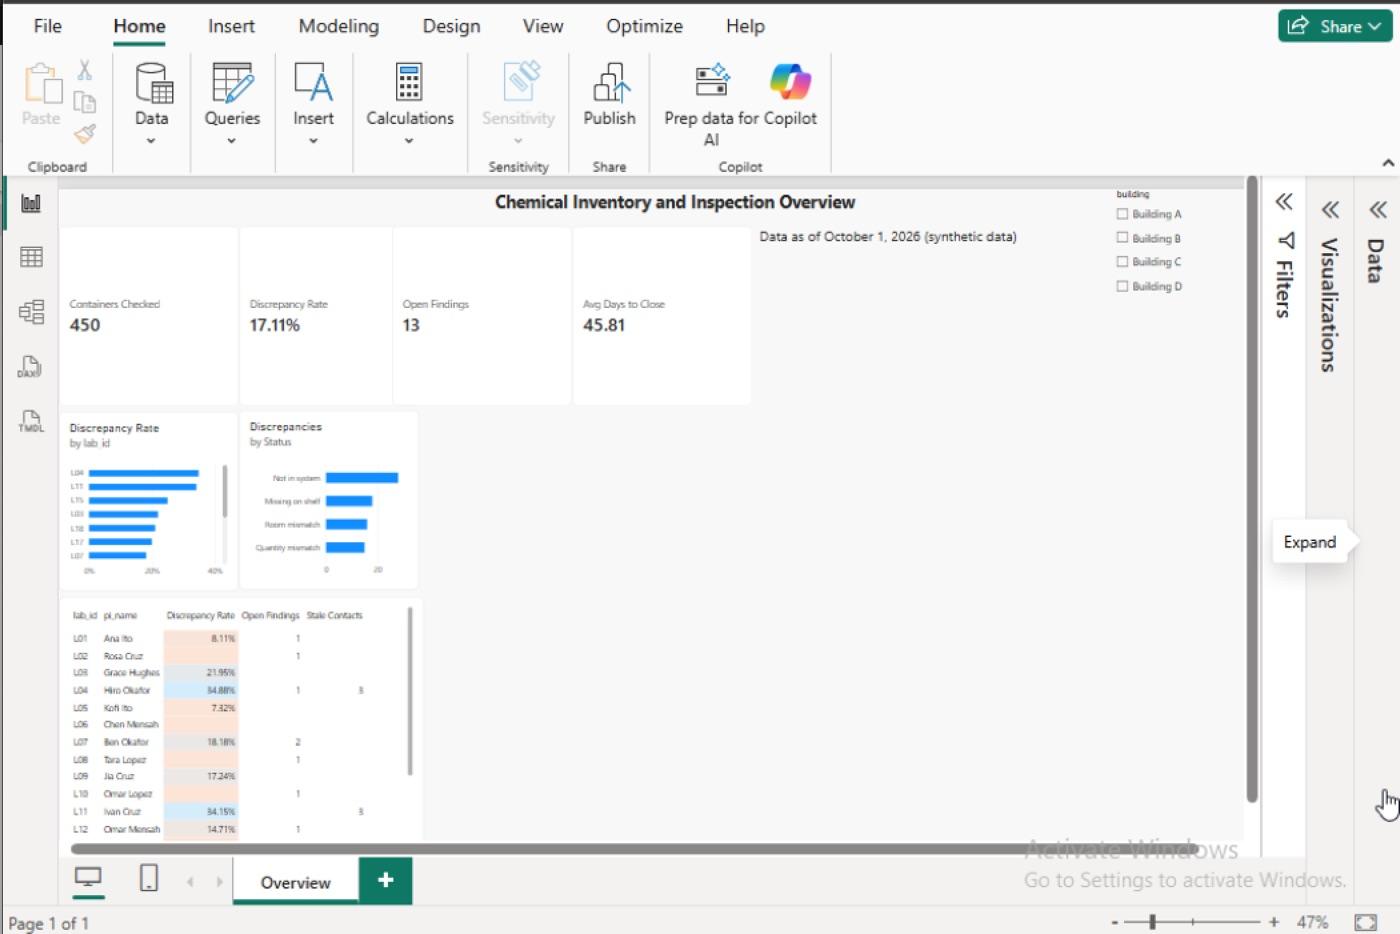 The finished one-page Power BI dashboard.
1. Messy synthetic data
generate_data.py writes seven CSV files with a fixed random seed, so every run is identical (580 system rows, 432 field rows). It injects the problems a real export would have: name variants, missing CAS numbers, inconsistent units, mixed date formats, duplicate records, and field discrepancies.
Two design decisions drive everything after it. The CAS number identifies a chemical, because names are typed by hand and drift ("IPA", "Isopropyl alcohol", "Isopropanol"). The container barcode is the reconciliation key, because it is what gets scanned on the shelf.
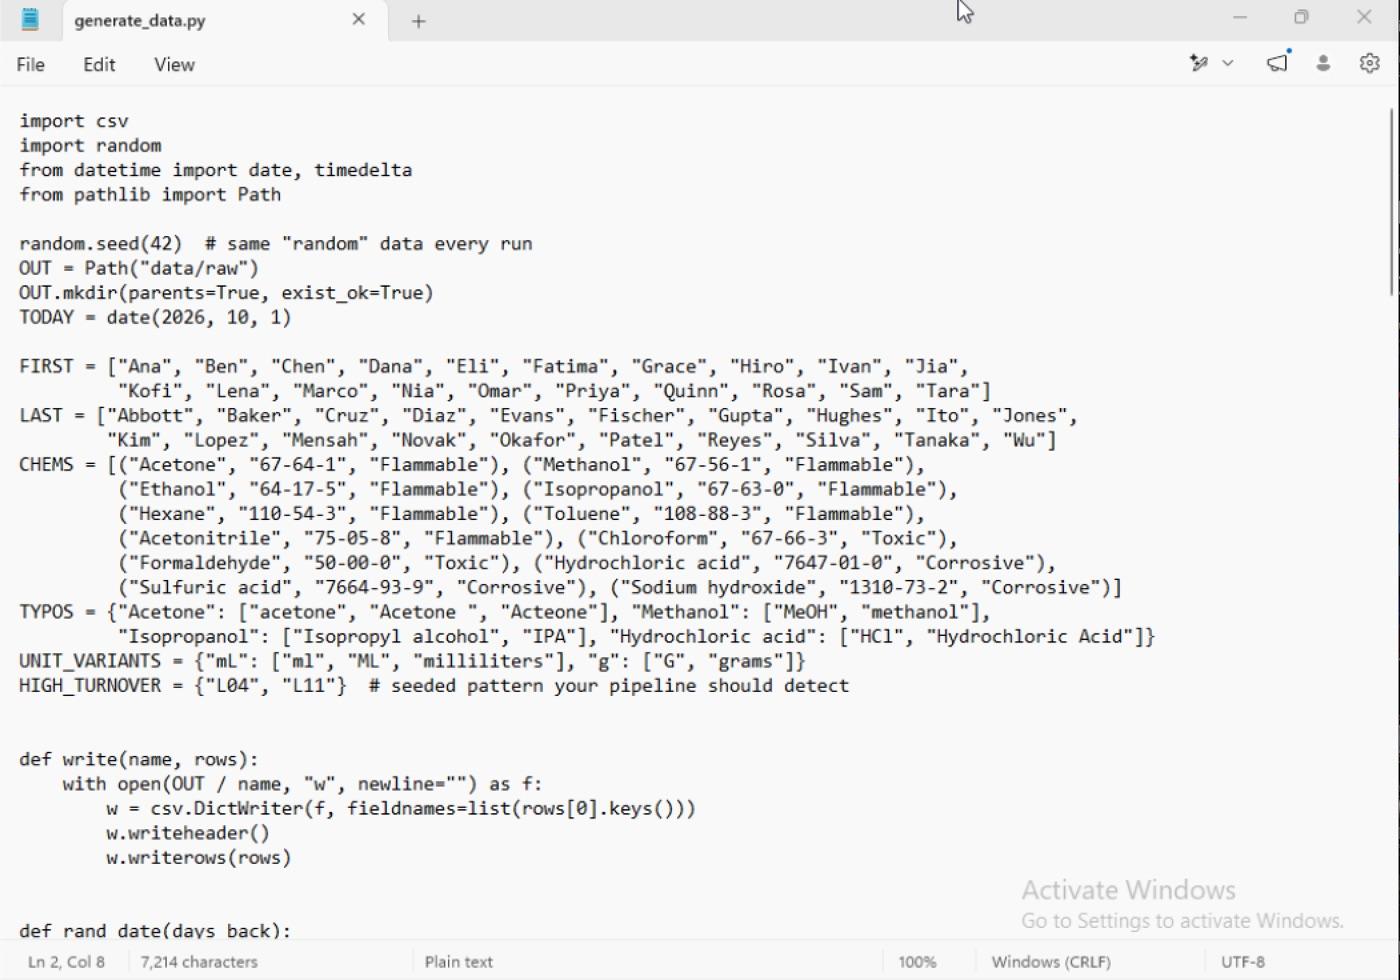 The data generator: reference lists, typo and unit variants, and the seeded high-turnover labs.
2. Cleaning and administration in SQLite
The export loads into an unconstrained staging table, gets checked, and is then cleaned into a real inventory table with keys and constraints. The checks found 16 duplicate containers, 12 missing CAS numbers, 7 spellings of 2 units, and 32 names that disagreed with their CAS number. One statement cleaned all of it, taking 580 records down to 564.
I also practiced the administration side: account creation, value updates, deactivating stale accounts, a saved status view, an audit log, and a backup that was restored after deliberately breaking the database.
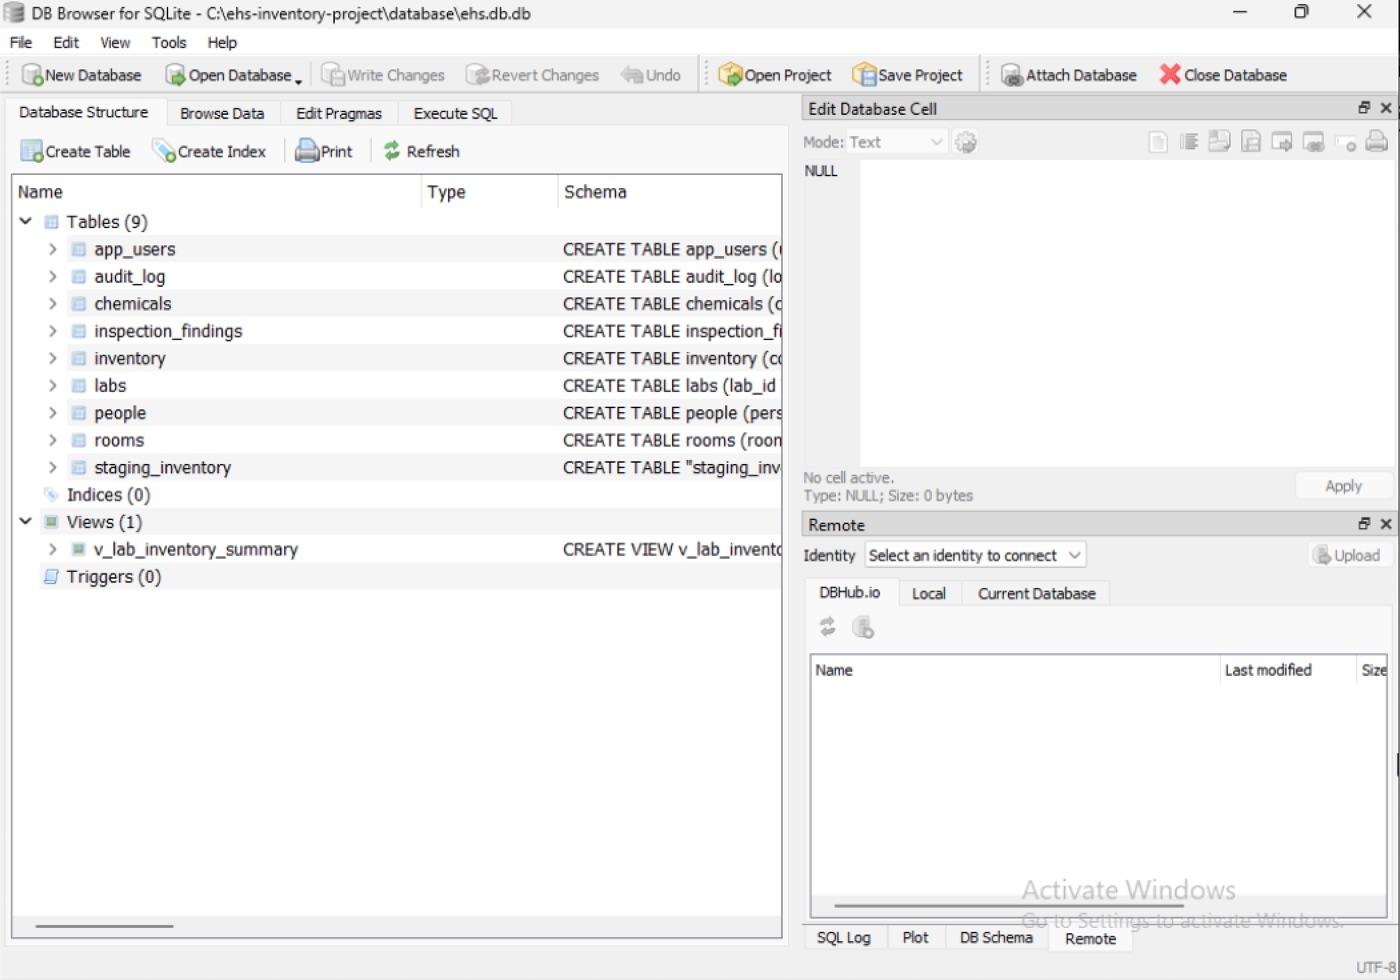 The database structure: nine tables and a lab inventory summary view.
3. Two Microsoft Forms surveys
A field verification survey is filled in during a lab visit, one response per container. Lab and room are drop-downs, quantity accepts numbers only, unit is a fixed choice, and answering "Not found" skips the quantity question. A contact confirmation survey goes to lab members to keep rosters current. Each form was piloted with 10 test responses.
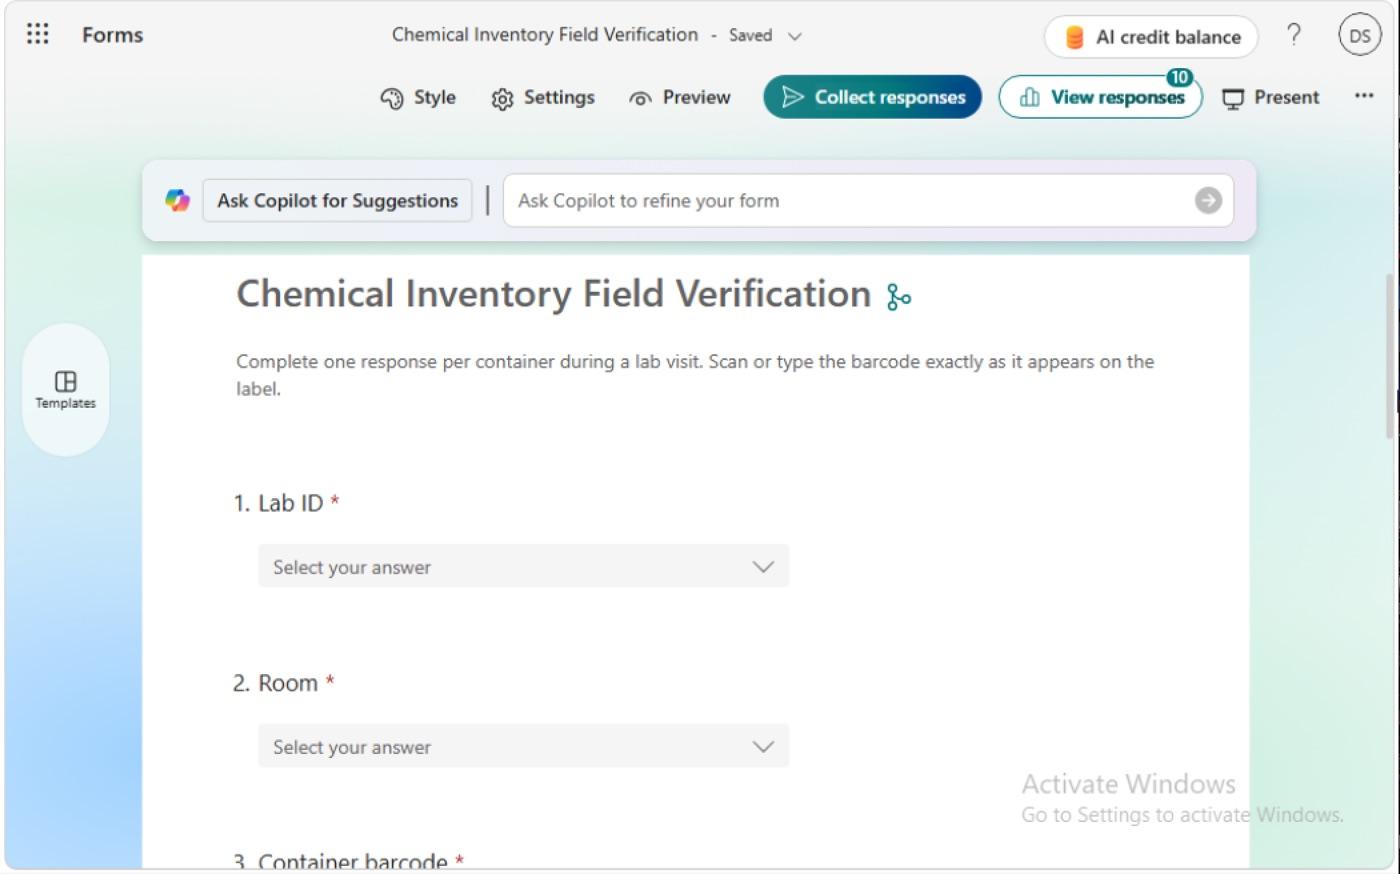 Closed questions wherever possible, so the data arrives clean.
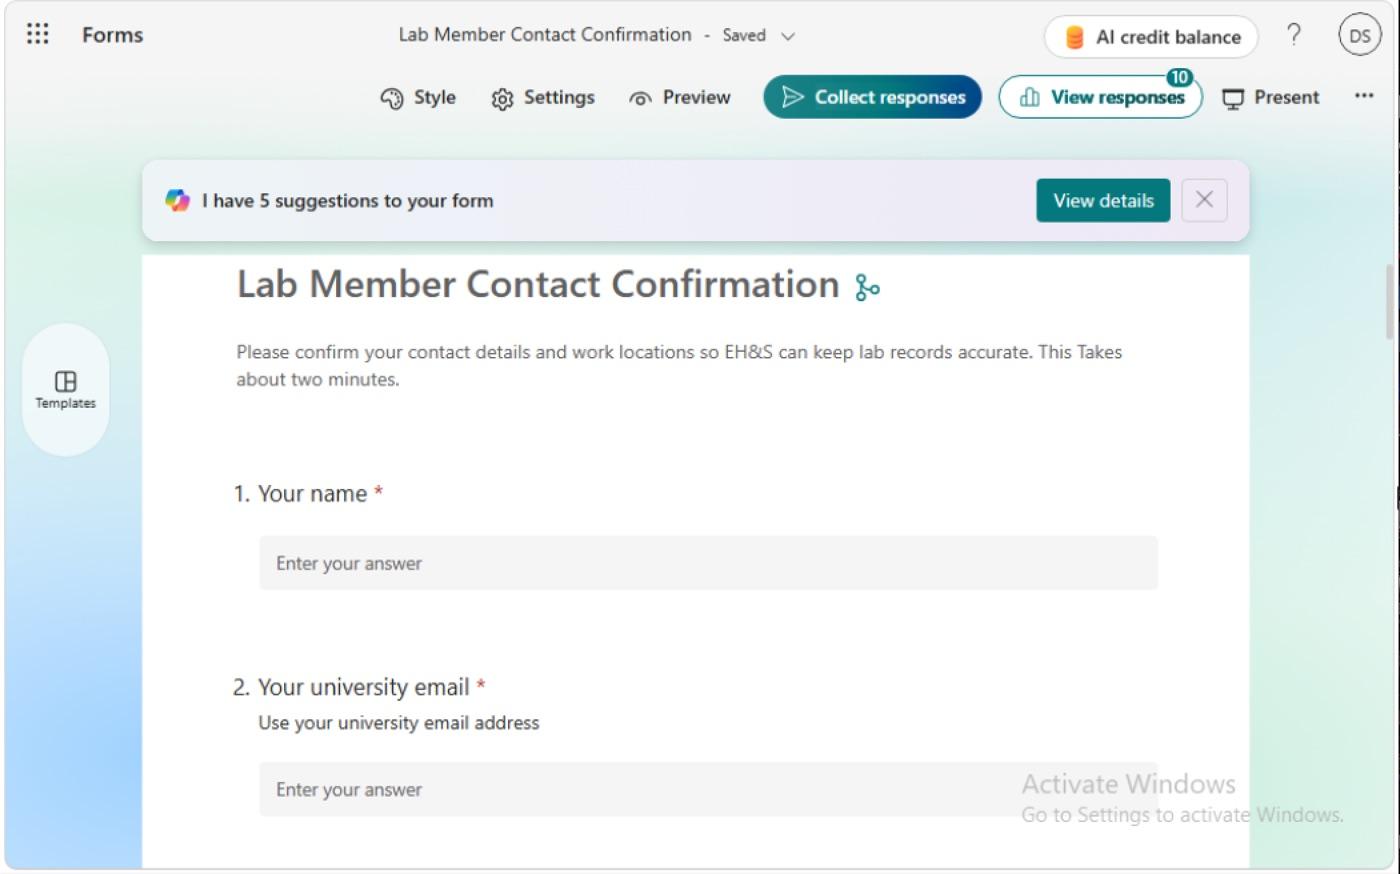 The contact survey branches to "who has left?" only when someone has.
4. Reconciliation in Power Query
This is the centerpiece. The system export is cleaned and each chemical gets a standard name, looked up first by CAS number and then through an alias table. The system rows are then filtered to the 14 visited labs, which matters: without that filter, every container in the six unvisited labs would show as missing from the shelf. A Full Outer merge on container ID against the field data gives 450 rows, and a Status column labels each one:
if [container_id] = null then "Not in system"
else if [Field.container_id] = null then "Missing on shelf"
else if [room_id] <> [Field.room_id] then "Room mismatch"
else if [quantity] <> [Field.quantity] then "Quantity mismatch"
else "Match"
Refresh All reruns the whole pipeline on new data.
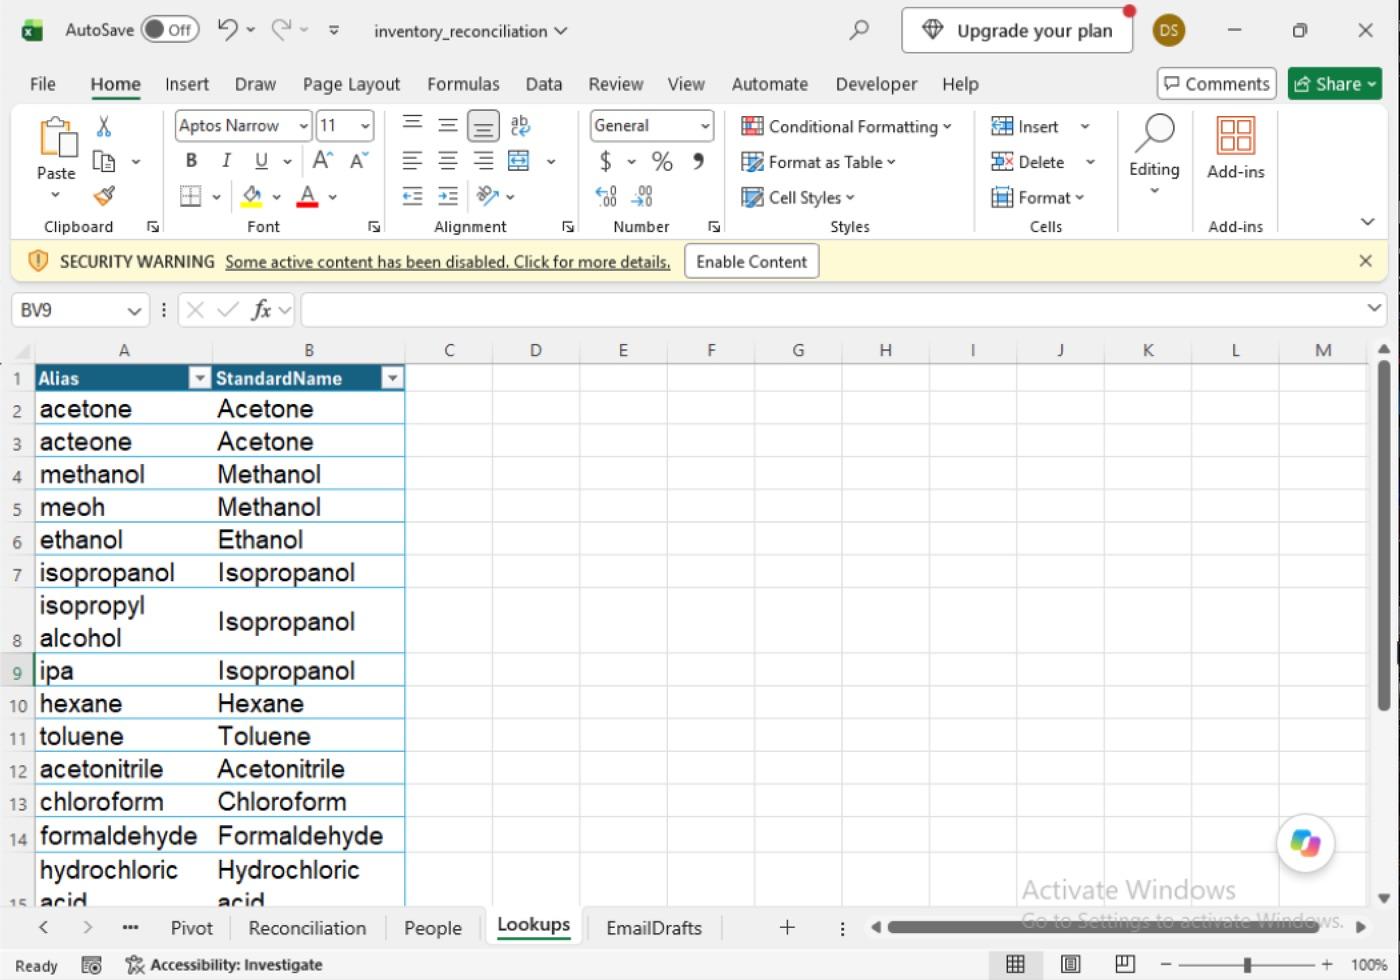 The alias table that maps typos and abbreviations (MeOH, IPA, HCl) to standard names.
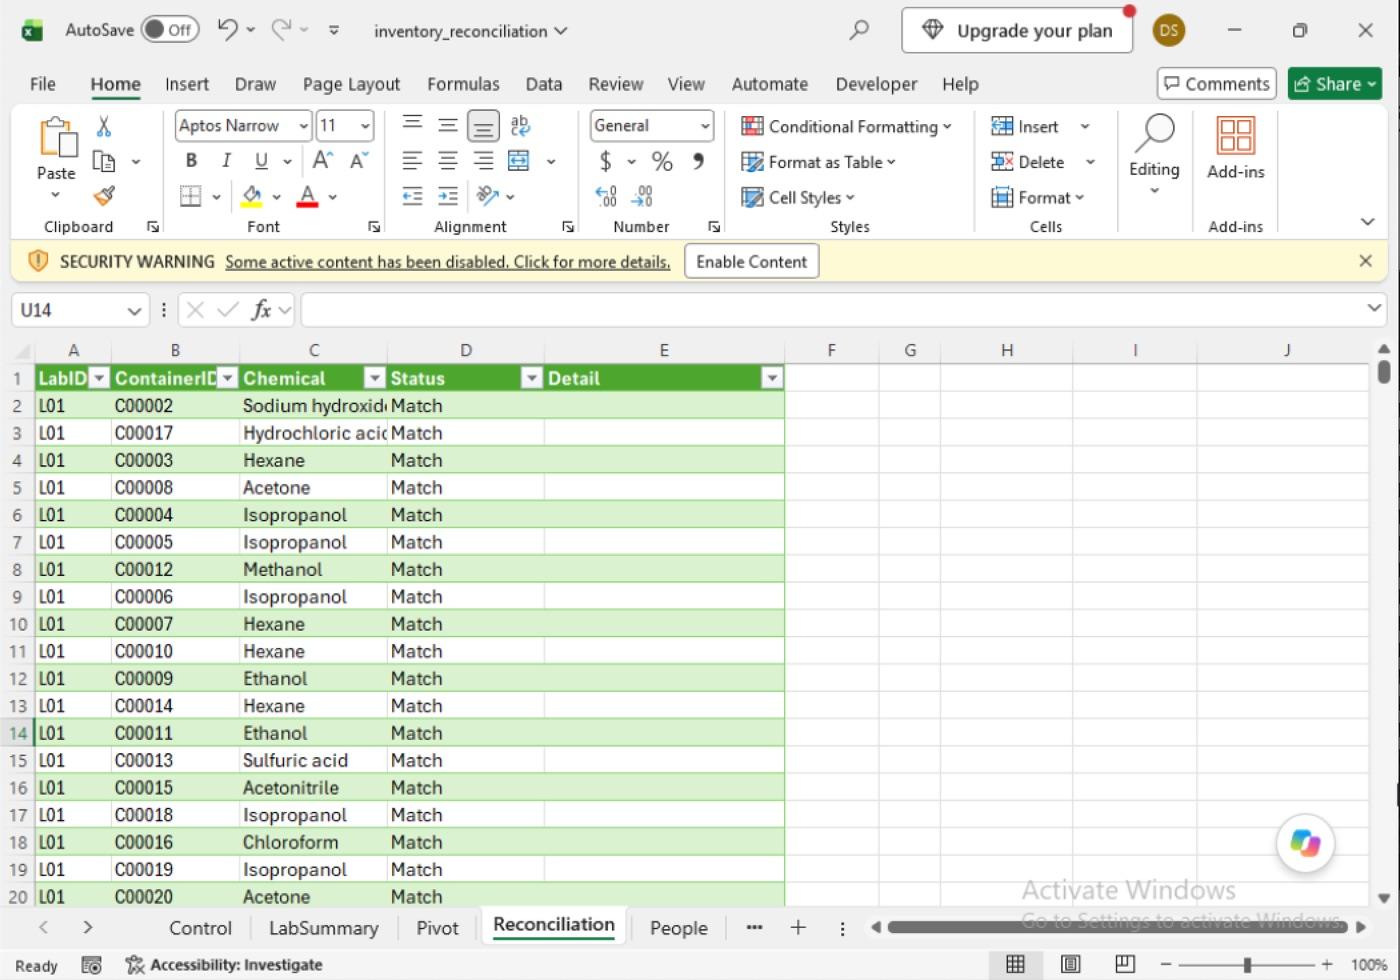 Every container, labeled as a match or a specific discrepancy.
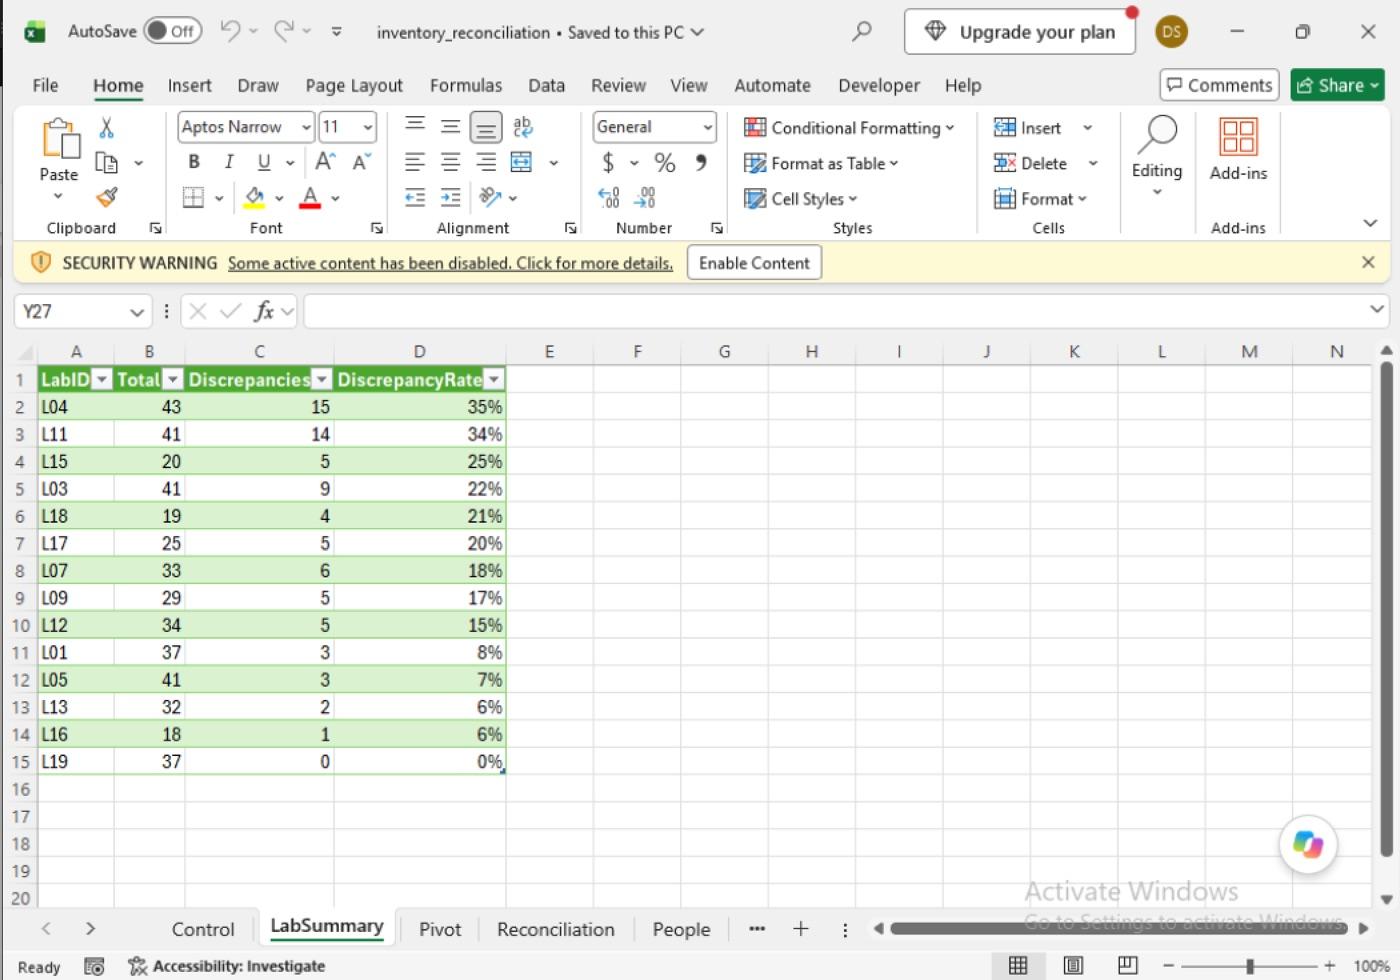 Discrepancy rate by lab: L04 and L11 land on top.
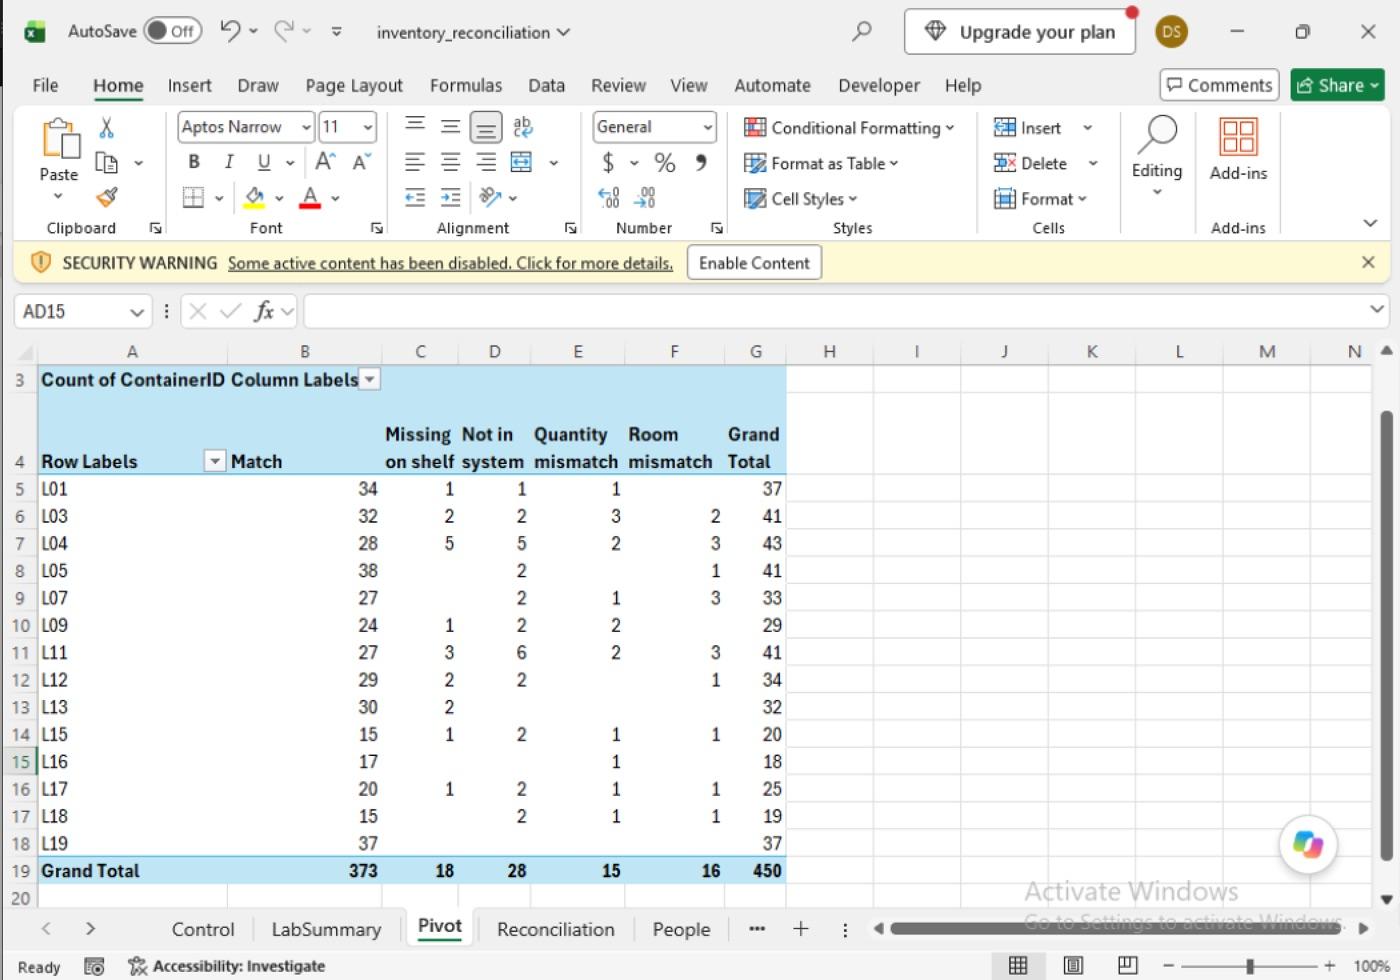 Status by lab: 373 matches and 77 discrepancies in 450 containers.
5. Follow-up automation in VBA
Three macros turn the results into action. One saves a discrepancy report workbook for every lab with issues. One writes a reminder email for each of those labs, addressed to the lab manager, or flagged "NO LAB MANAGER ON FILE" when there is none. The third refreshes the data and runs both, from one button. The macros write drafts to a sheet rather than sending anything, so a person reviews every message before it goes out.
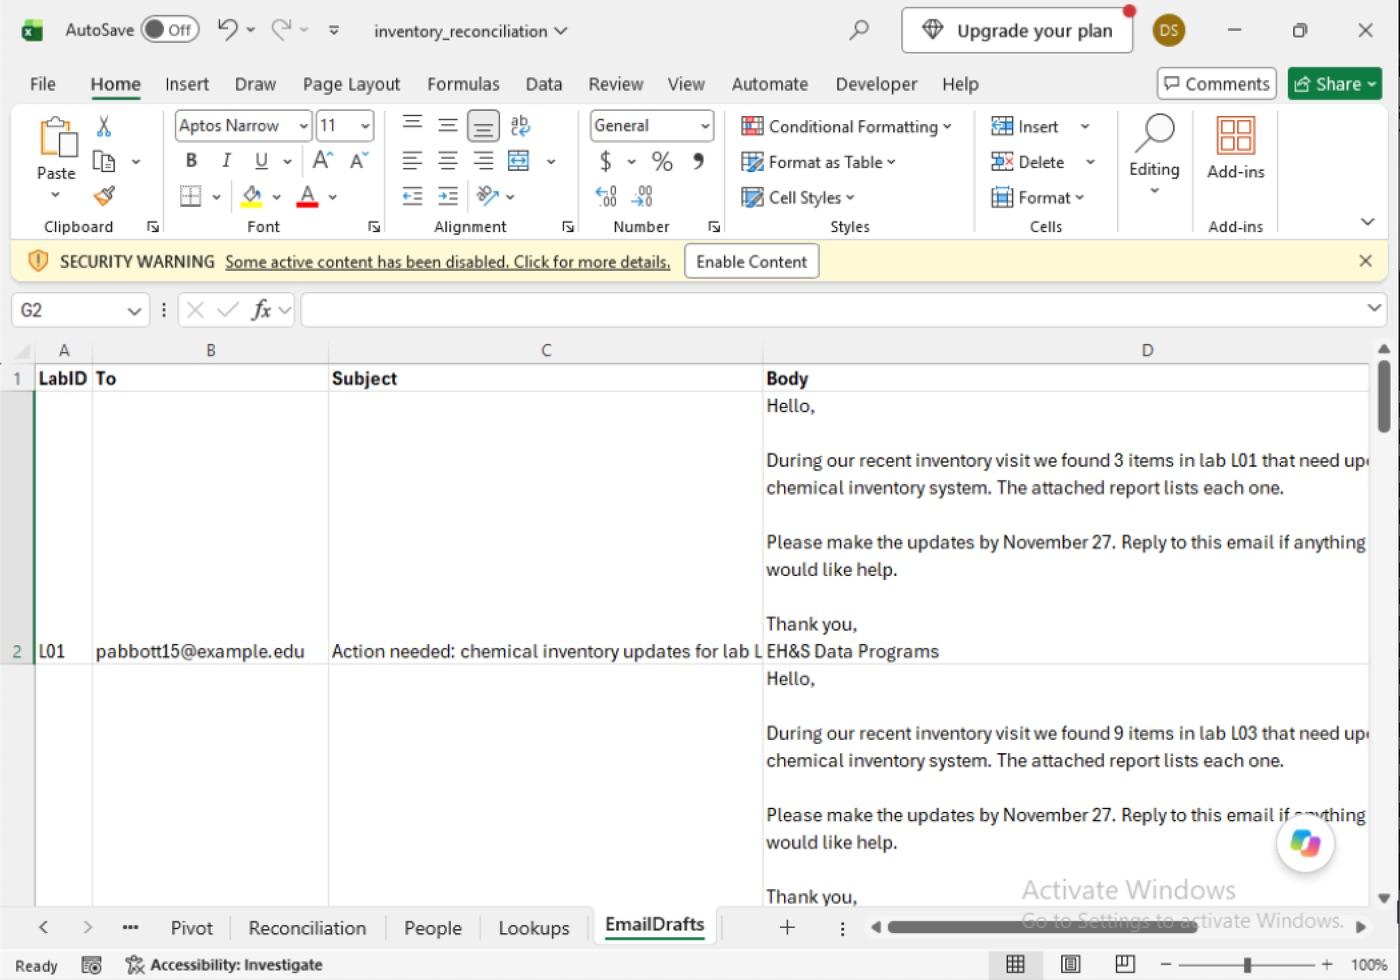 One draft per lab with issues, with the count and a due date filled in.
6. Dashboard in Power BI
A one-page report with four cards, a discrepancy rate by lab, discrepancies by status, a conditionally formatted lab table, and a building slicer, on a star schema with the labs table in the middle. It uses six DAX measures. One bug taught me something: a first version of the Discrepancies measure showed the same total on every bar of the status chart, including Match, because its own filter replaced the chart's. Wrapping the condition in KEEPFILTERS fixed it:
Discrepancies =
CALCULATE(
    COUNTROWS(Reconciliation),
    KEEPFILTERS(Reconciliation[Status] <> "Match")
)
7. Scheduled reminders (designed, not built)
A monthly Power Automate flow would send each lab manager their reminder with the report attached, and email EH&S a summary of labs with no manager on file and any failed sends. Building it needs a Microsoft work or school account, which I did not have, so I wrote the full specification instead: steps, error handling, least-privilege and governance notes, and a test plan. It is in the GitHub repository.
Findings
- 17.11% of containers checked had a discrepancy (77 of 450). L04 (15 of 43, 35%) and L11 (14 of 41, 34%) lead, and L19 had none.
- The most common problem is containers on the shelf that were never entered (28 of 77), followed by containers listed but not found (18), found in the wrong room (16), and wrong quantity (15). The system undercounts what is actually stored.
- The two high-turnover labs hold 19% of the containers but 38% of the discrepancies, with rates above one in three versus 13% across the other 12 labs, and they account for every out-of-date contact record.
Recommendations
- Visit high-turnover labs first. Contact age is a cheap early-warning signal for where records have drifted.
- Confirm lab rosters every six months with the contact survey, so reminders reach someone who can act on them.
- Require a CAS number and a fixed unit list at data entry, so names and units cannot drift.
- Schedule the six unvisited labs so every lab is verified at least once.
Limits
The data is synthetic and the pattern was seeded, so the finding shows that the pipeline works, not that real labs behave this way. With real data there would be more edge cases, such as shared, consumed, or relabeled containers, and I would check the rules with lab staff before trusting them. The source code, SQL, Power Query formulas, VBA, DAX, and the written summary are all in the GitHub repository.